Ever feel like you're grappling with invisible forces when dealing with 3-phase power? Understanding the flow of electricity in these systems can seem like a dark art. But there’s a powerful tool that can illuminate these complexities: the phasor diagram. Mastering this visual representation can unlock a deeper understanding of AC circuits and empower you to analyze and troubleshoot electrical systems effectively. Ready to ditch the confusion and embrace clarity?
Three-phase power systems are the backbone of modern electricity distribution. They transmit power more efficiently than single-phase systems, making them ideal for industrial applications and large-scale power grids. But their interconnected nature introduces a level of complexity that requires a different approach to visualization. That’s where phasor diagrams come in.
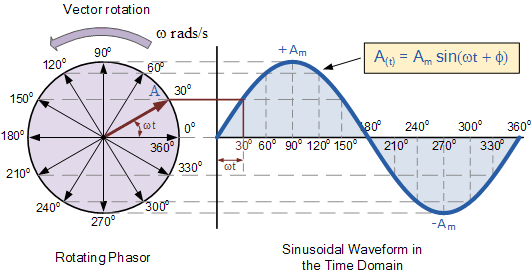
Imagine trying to track three sine waves simultaneously, each representing the voltage or current in a different phase. It quickly becomes a tangled mess. A phasor diagram simplifies this by representing each sinusoidal quantity as a rotating vector, or "phasor." The length of the phasor represents the magnitude of the quantity, and its angle represents its phase shift relative to a reference. This allows you to see the relationship between the three phases at a glance.
Representing 3-phase systems graphically through phasor diagrams has a rich history intertwined with the development of AC power systems. Early electrical engineers, grappling with the challenges of analyzing complex AC circuits, recognized the need for a visual tool. Charles Proteus Steinmetz, a pioneer in AC power theory, played a crucial role in popularizing the use of phasor diagrams in the late 19th and early 20th centuries. His work laid the foundation for modern power system analysis.
The core issue phasor diagrams address is the representation of sinusoidal quantities that vary with time. Instead of dealing with complex trigonometric equations, phasors allow us to use simple vector algebra to analyze these systems. This simplification is crucial for understanding complex phenomena like power factor, impedance, and fault analysis in 3-phase circuits.
Constructing a 3-phase phasor diagram involves representing each phase voltage or current as a phasor. These phasors are typically 120 degrees apart, reflecting the phase shift in a balanced 3-phase system. For example, if phase A is the reference, phase B will lag by 120 degrees, and phase C will lead by 120 degrees.
Benefits of using phasor diagrams include: Simplified analysis of complex AC circuits, Visualization of phase relationships, and Easier calculation of power and other electrical quantities.
To create a phasor diagram: Determine the magnitude and phase angle of each phase, Draw each phasor as a vector with the correct length and angle, Label each phasor clearly, and Use the diagram to analyze the circuit.
Checklist: Magnitude of each phase, Phase angle of each phase, 120-degree separation between phases, Clear labels.
Step-by-step guide: Draw a reference axis, Draw the phasor for phase A, Draw the phasor for phase B lagging by 120 degrees, Draw the phasor for phase C leading by 120 degrees.
Advantages and Disadvantages of Phasor Diagrams
| Advantages | Disadvantages |
|---|---|
| Simplifies complex AC circuit analysis | Assumes sinusoidal waveforms |
| Visualizes phase relationships | Can be challenging for complex systems |
Best Practices: Choose a suitable scale, Label all phasors clearly, Use different colors for different phases, Indicate the direction of rotation, Verify the diagram against circuit parameters.
Real Examples: Analyzing motor performance, Calculating fault currents, Designing power systems, Understanding transformer operation, Analyzing generator synchronization.
Challenges and Solutions: Complex systems - Break down into smaller components, Non-sinusoidal waveforms - Use harmonic analysis, Difficulty visualizing 3D relationships - Use software tools.
FAQ: What is a phasor? How are phasors used? What is the significance of 120 degrees? How do I calculate phasor values? What are the limitations of phasor diagrams? What are some applications of phasor diagrams? How are phasor diagrams used in power systems? What are the advantages of using phasor diagrams over other methods?
Tips and Tricks: Use software tools for complex diagrams, Practice with simple circuits first, Remember the 120-degree relationship, Label everything clearly.
Mastering phasor diagrams is a crucial skill for anyone working with 3-phase power systems. They provide a powerful tool for visualizing and analyzing complex electrical circuits, simplifying calculations, and troubleshooting problems. By understanding the principles of phasor representation, you can unlock a deeper understanding of how electricity flows in these vital systems. Start practicing with simple examples, explore different software tools, and soon you'll be confidently navigating the world of 3-phase power. Don't just be a passive consumer of electricity; become a master of its flow!
Phasor Diagram Of Ac Circuit - The Brass Coq
Transformer Nameplate Phasor Diagram - The Brass Coq
How To Draw A Phasor Diagram For 3 - The Brass Coq
Phasor Diagrams Lcr Circuits - The Brass Coq
Ac Circuit Phasor Diagram Impedance - The Brass Coq
Phasor Diagrams Of Ac Circuits - The Brass Coq
DIAGRAM Single Phase Phasor Diagram - The Brass Coq
Online Phasor Diagram Maker - The Brass Coq
Ac Circuit Phasor Diagram Impedance - The Brass Coq
Three Phase Delta Connection Three Phase PowerVoltageCurrent - The Brass Coq
RC Circuit Phasor Diagram - The Brass Coq
Rc Series Circuit Phasor Diagram - The Brass Coq
Phasor Diagram Of Capacitor In Ac Circuit - The Brass Coq
Basic Phasor Diagram Electric Circuit - The Brass Coq
Wiring Phase Three Diagram Alirconditiong - The Brass Coq


